


The Relative Strength Index or RSI indicator is among the most popular indicators used by traders to identify and generate trading opportunities in the markets. The RSI provides information about the strength of the price movements on your charts, hence the name.
Key Takeaways from the RSI indicator trading guide
- Relative Strength Index (RSI) is a momentum oscillator that measures the speed and strength of price movements, usually over 14 periods. It helps traders gauge market momentum rather than just price levels.
- RSI values range from 0 to 100, with readings above 70 considered overbought and below 30 oversold. These levels signal potential price weakness or strength but don’t guarantee reversals on their own.
- Traders use RSI divergence—when RSI trends differ from price trends—to spot possible reversals. Bullish divergence suggests a potential rise, while bearish divergence signals a possible decline.
- RSI can also highlight support, resistance, and breakout points. Patterns like swing rejection in RSI help identify entry or exit signals, but RSI works best combined with other indicators in a trading strategy.
What is RSI?
The Relative Strength Index (RSI) is a technical indicator that traders could use to examine how the price is performing over a certain period. It is a momentum oscillator that measures the magnitude of price movements as well as the speed (velocity) of these movements. The RSI can be an extremely helpful tool depending on the trader's profile and their trading setup.
For illustrative purposes only
The Relative Strength Index indicator was created by J. Welles Wilder in 1978. It was presented in his book New Concepts in Technical Trading Systems, along with other trading indicators, such as the Parabolic SAR, the Average True Range (ATR), and the Average Directional Index (ADX).
Before becoming a technical analyst, Wilder worked as a mechanical engineer and real estate developer. He started trading stocks around 1972 but was not successful. A few years later, Wilder compiled his trading research and experience into mathematical formulas and indicators that were later adopted by many traders around the world. The book was produced in only six months, and despite dating back to the 1970s, it is still a reference to many chartists and traders today.
RSI Calculation Formula
- RSI = 100 - 100 (1 + RS),
- RS = Average Gain / Average Loss
To simplify the RSI calculation formula, please note that RSI has been broken down into its basic components: RS, Average Gain, and Average Loss. This RSI calculation formula is based on 14 periods, which is the default suggested by Wilder in his book. Losses are expressed as positive values, not negative values.
The very first calculations for average gain and average loss are simple 14-period averages:
- First Average Gain = Sum of Gains over the past 14 periods / 14
- First Average Loss = Sum of Losses over the past 14 periods / 14
The second, and subsequent, calculations are based on the prior averages and the current gain loss:
- Average Gain = [(previous Average Gain) x 13 + current Gain] / 14
- Average Loss = [(previous Average Loss) x 13 + current Loss] / 14
Taking the prior value plus the current value is a smoothing technique like that used in calculating an exponential moving average (EMA). This also means that RSI values become more accurate as the calculation period extends.
RSI Settings
The standard setting for the RSI is 14 periods which means that the RSI evaluates the last 14 candles or time periods.
The RSI compares the average gain and the average loss and analyses how many of the past 14 candles were bullish versus bearish and it also analyses the candle size of each candlestick.
For example, if all 14 price candles were bullish, the RSI would be 100 and if all 14 price candles were bearish, the RSI would be 0 (or close to 100 and 0). And an RSI of 50 would mean that 7 past candles were bearish, 7 were bullish and the size of the average gain and loss was equal. The more candles were bullish than bearish, the higher the RSI is.
Example 1
The highlighted area includes the past 14 price candles which the RSI analyses. Out of those 14 candles, 12 were bullish and only 2 were bearish which resulted in an RSI of 83.
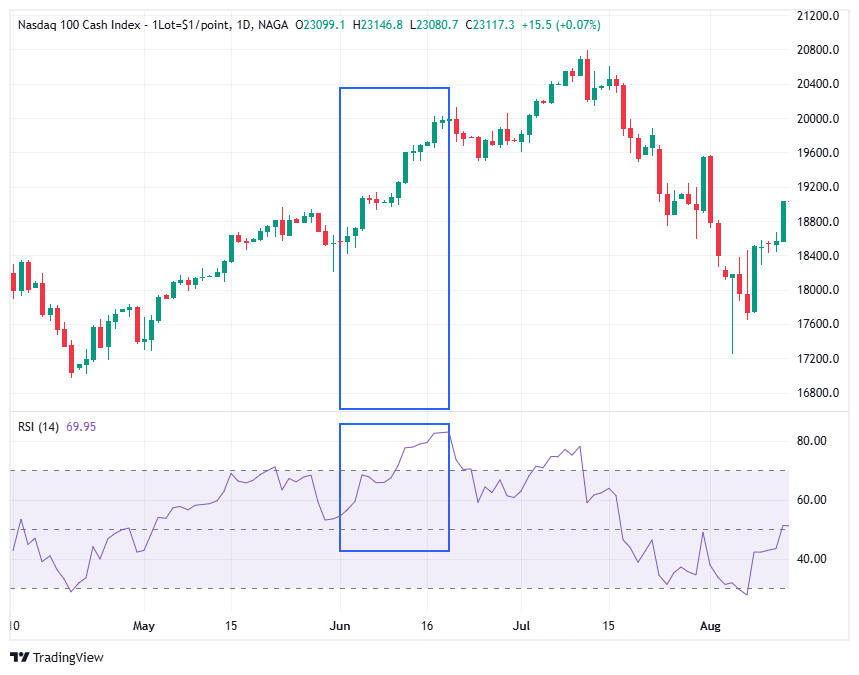
For illustrative purposes only. Past performance is not indicative of future results.
Example 2
Here are 3 more case studies to help us understand the RSI and how it forms:
- The first includes 11 bullish candles and 3 (mostly small) bearish candles. The RSI of this period was 81 which is a relatively strong bullish move because the bulls were in control here.
- The second area includes 5 bearish candles, and 9 bullish candles, resulting in an RSI around 50 which signals moderate bullish strength as the balance is relatively equal.
- The third area marks a very bearish period with 9 bearish candles, 5 smaller bullish candles, with Doji. The RSI of this period was below 30 area which signals a bearish phase because the bears outnumbered the bulls.
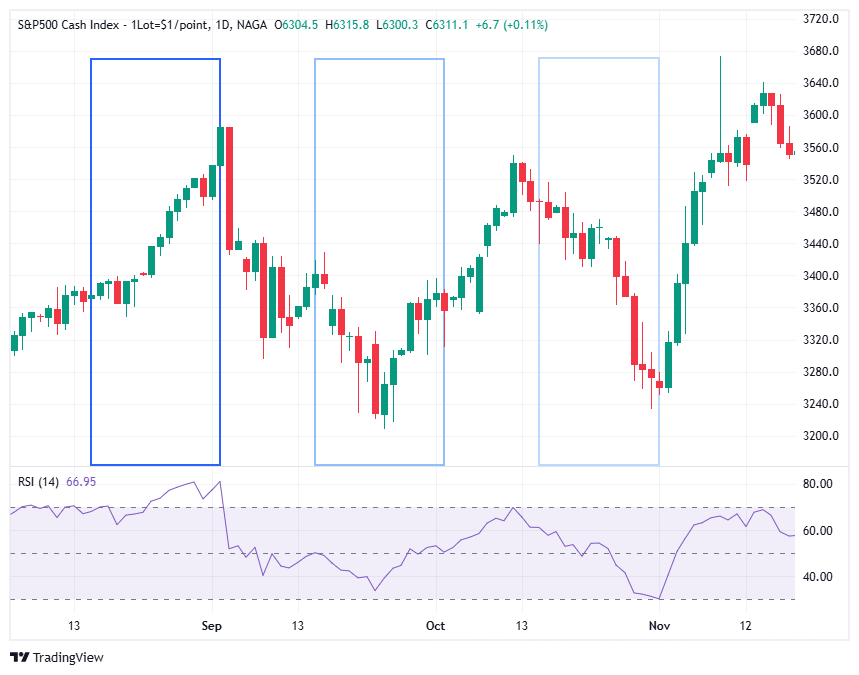
For illustrative purposes only. Past performance is not indicative of future results.
How to use the relative strength index
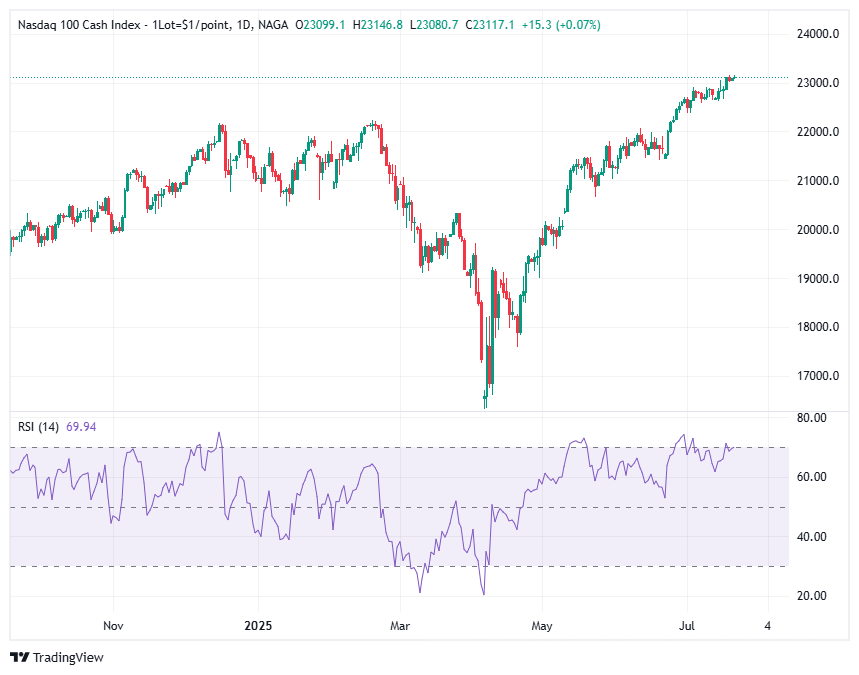
The RSI can be used in several ways to determine market trends. The most popular way of measuring market trends is to evaluate whether a security is overbought or oversold.
Oversold and Overbought
The general idea is that when the RSI shows extremely high or extremely low values (higher than 70 or lower than 30), the price is said to be oversold or overbought. But let’s recap what we have just learned to see if this is true:
A high RSI simply means that there were more bullish candles than bearish candles. And although price can’t go on printing only bullish candles forever, it can be dangerous to believe that just because the RSI shows overbought conditions that the price is likely to reverse. Once we understand what the RSI does, we can see that overbought and oversold and NOT signals that indicate that price will turn. The uptrend can continue for a period with RSI overbought, while the downtrend can continue for a period with RSI oversold.
It’s a myth and it shows misinformation when traders refer to overbought and oversold to define markets which will reverse!
The below scenario shows a period in which the price kept falling for around 20 days before the RSI turned back above 30 and left the oversold area. And still, there was no rally afterward. A trader who buys such a market just because the RSI is showing oversold conditions could accumulate huge losses. The RSI does NOT provide signals to buy when it is oversold. It simply means that the price is very weak as we have learned above.
For illustrative purposes only. Past performance is not indicative of future results.
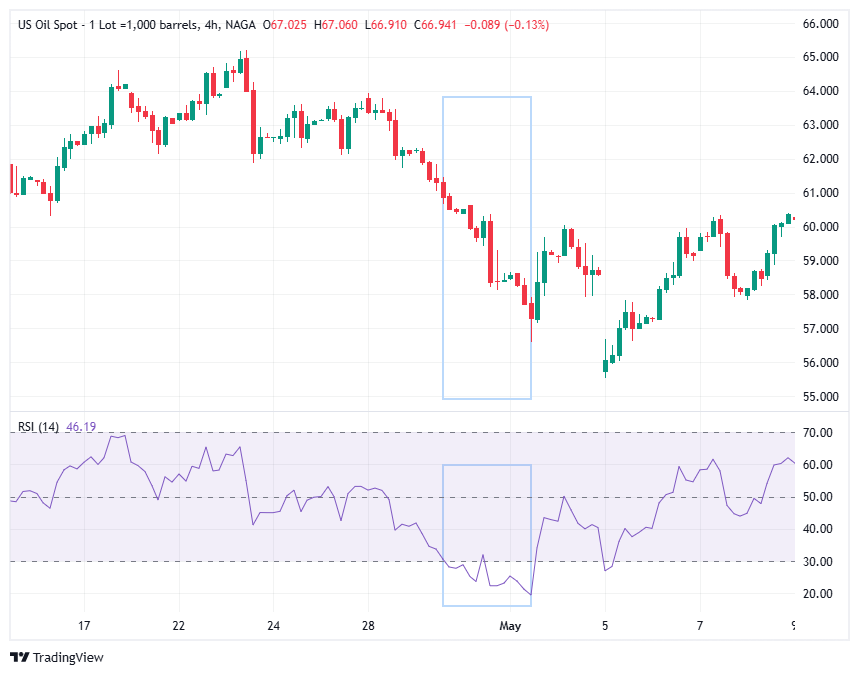
RSI For Support and Resistance
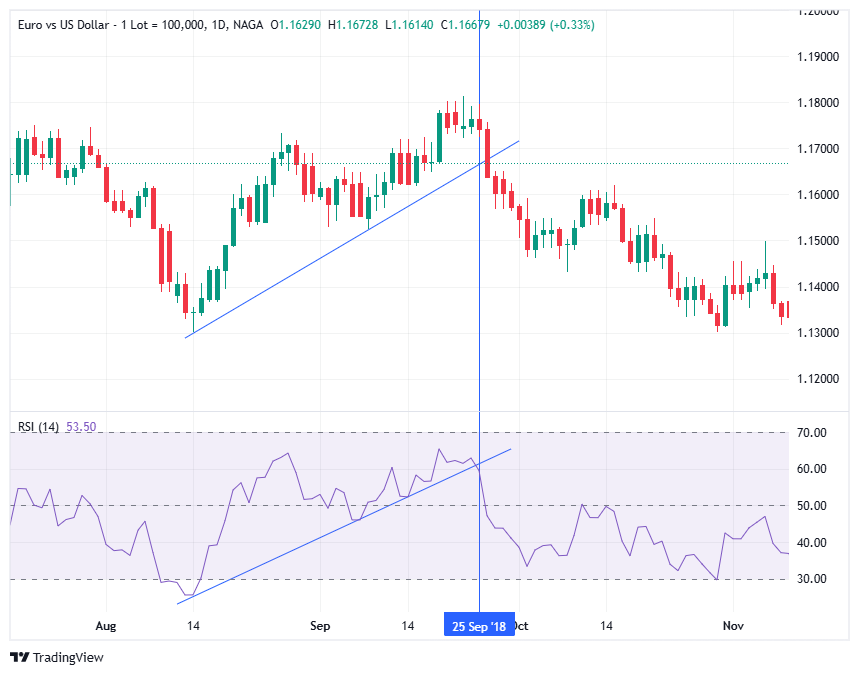
We have just discovered that the RSI identifies strong trending price movements when it moves at the extremes. And with this knowledge, the RSI can be used when it comes to support and resistance, and breakout trading. The screenshot below shows a strong resistance level marked in black.
Support and resistance levels on the RSI could help determine situations where negative or positive momentum is accelerating. In the chart below, the RSI broke down through the trendline support. This signals the price trendline is at risk and a breakout could follow.
This could be a strong signal for bulls that the trading conditions might change, and a reversal of the trend is more likely.
When the RSI moves higher back to the trend line, it offers an opportunity to look for short setups.
For illustrative purposes only. Past performance is not indicative of future results.
The RSI can be a useful tool when it comes to quantifying price strength because that is what the RSI does: it analyses momentum and price strength.
RSI Divergence
Another way of using the RSI to identify turning points is by finding divergences. An RSI divergence signals that what price is showing you, is usually not supported by the underlying price dynamics.
Positive/bullish RSI divergence
For a positive divergence, we look at the lows of both the price and the indicator. If the price is making higher lows, and the indicator is making lower lows, a positive or bullish divergence signal is considered. It is preferable to witness this occurs when the RSI is in oversold territory.
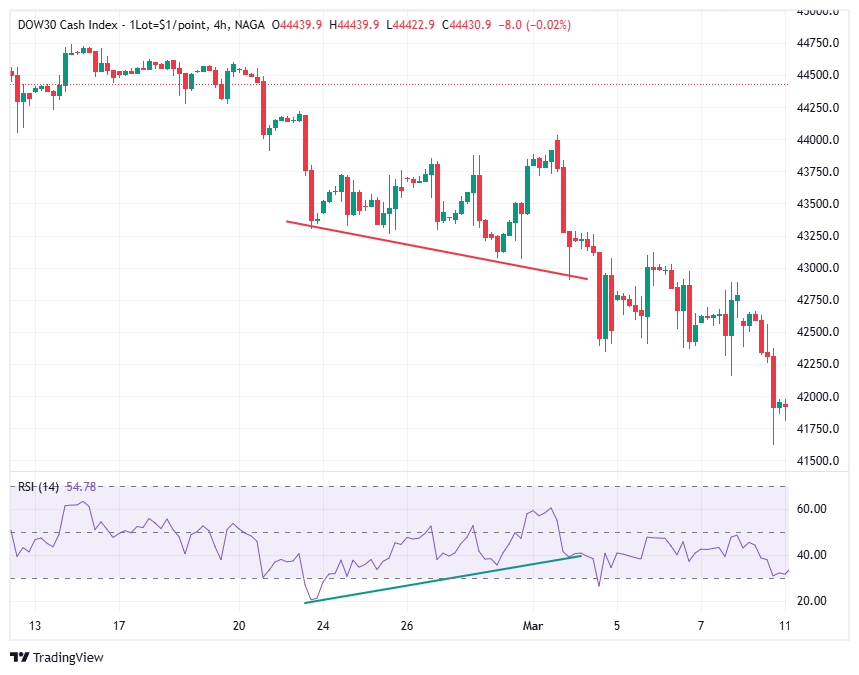
For illustrative purposes only. Past performance is not indicative of future results.
A positive or bullish divergence suggests short-term gains in the securities price to follow. A positive divergence signal in conjunction with an oversold signal is considered by many market technicians to be a more powerful 'buy' signal than an oversold signal in isolation.
Negative/bearish RSI divergence
For a negative divergence, we look at the highs of both the price and the indicator. If the price is making higher highs, and the indicator is making lower highs, a negative or bearish divergence signal is considered. It is preferable to witness this occurs when the RSI is in overbought territory.
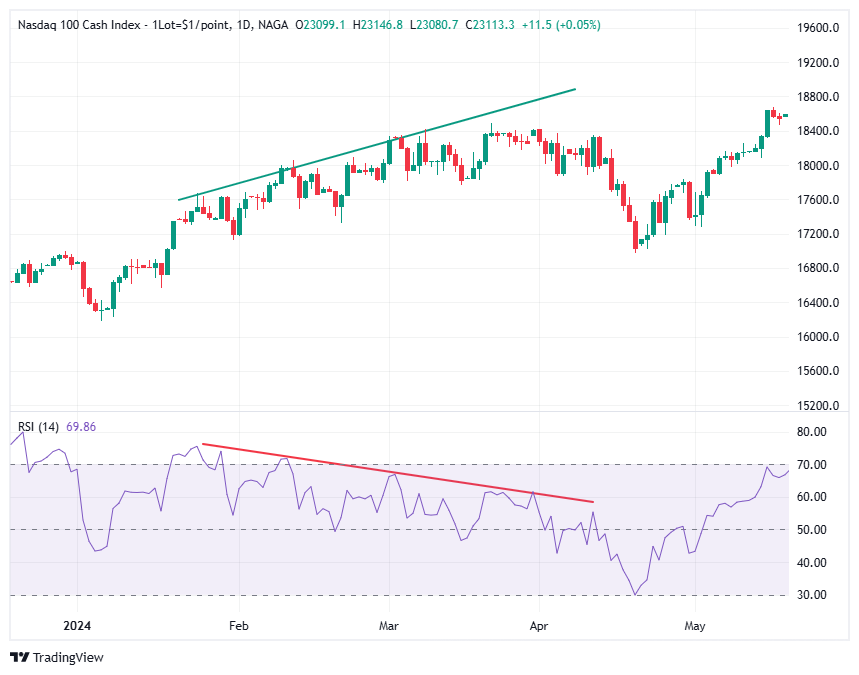
For illustrative purposes only. Past performance is not indicative of future results.
A negative or bearish divergence suggests a short-term decline in the securities price to follow. A negative divergence signal in conjunction with an overbought signal is considered by many market technicians to be a more powerful 'sell' signal than just an overbought signal in isolation.
How to trade with RSI
When you see the RSI signals and you want to place a trade, you can do so via derivatives such as CFDs. Derivatives enable you to trade rising as well as declining prices. So, depending on what you think will happen with the asset’s price when one of the Doji patterns appears, you can open a long position or a short position.
Follow these steps to trade when you see a price divergence and/or a wee:
- Trading with any type of momentum indicator requires patience and the ability to wait for confirmation. The appearance of one of these signals alerts traders of a price reversal, but signals against the trend are considered better for exits to trades rather than entries.
- To get started trading with RSI, open an account. Choose between a live account to trade CFDs straight away or practice first on our demo account with virtual funds.
- Choose your financial instrument. RSI signals can be spotted in most financial markets, especially those that are more volatile, such as forex, cryptocurrencies, and stocks.
- Explore our online trading platform. We offer multiple chart types that are not limited to candlestick charts, as well as providing a range of order execution tools for fast trading, which in turn helps you to manage risk.
The below strategies for trading with the RSI indicator are merely guidance and cannot be relied on for profit.
RSI Trading Strategy - Swing Rejections
Another trading technique examines the RSI's behavior when it is re-emerging from overbought or oversold territory. This signal is called a bullish "swing rejection" and has four parts:
- RSI falls into oversold territory.
- RSI crosses back above 30%.
- RSI forms another dip without crossing back into oversold territory.
- RSI then breaks its most recent high.
As you can see in the following chart, the RSI indicator was oversold, broke up through 30%, and formed the rejection low that triggered the signal when it bounced higher. Using the RSI in this way is similar to drawing trendlines on a price chart.
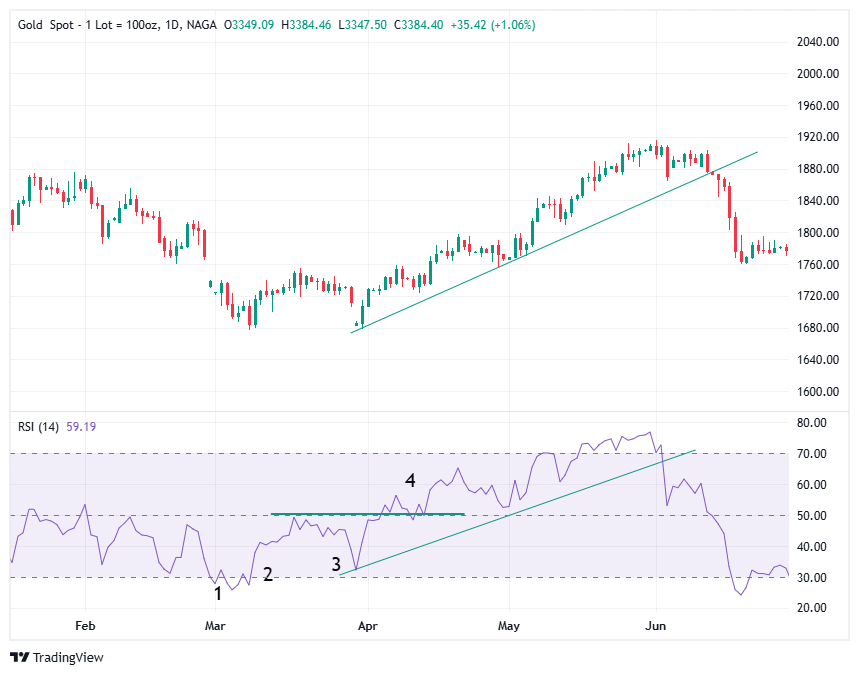
For illustrative purposes only. Past performance is not indicative of future results.
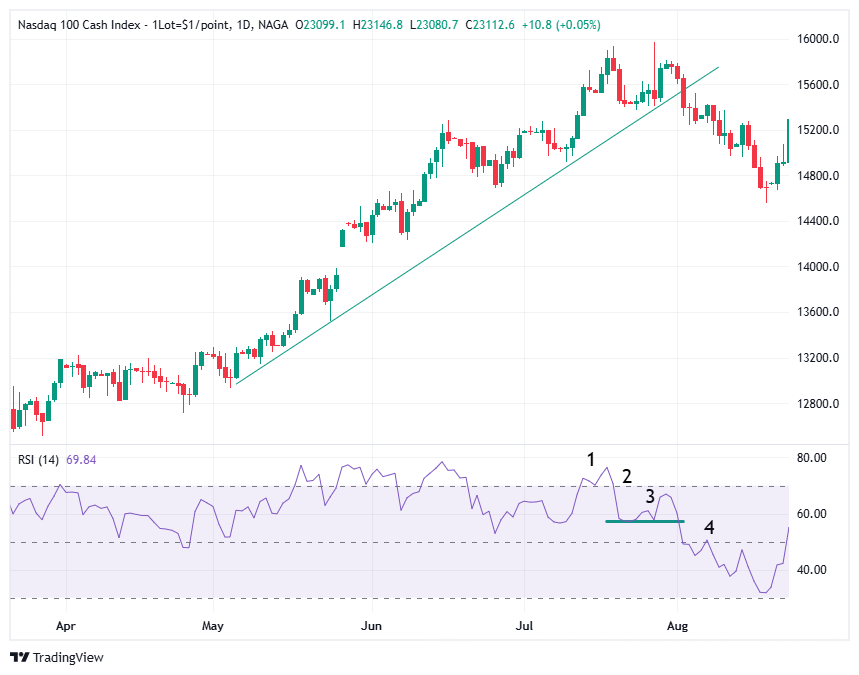
Like divergences, there is a bearish version of the swing rejection signal that looks like a mirror image of the bullish version. A bearish swing rejection also has four parts:
- RSI rises into overbought territory.
- RSI crosses back below 70%.
- RSI forms another high without crossing back into overbought territory.
- RSI then breaks its most recent low.
The following chart illustrates the bearish swing rejection signal. As with most trading methods, this signal will be most reliable when it conforms to the prevailing long-term trend. Bearish signals in negative trends are less likely to generate a false alarm.
For illustrative purposes only. Past performance is not indicative of future results.
Limitations of the RSI
The RSI compares bullish and bearish price momentum and displays the results in an oscillator that can be placed beneath a price chart. Like most technical indicators, its signals are most reliable when they conform to the long-term trend.
True reversal signals are rare and can be difficult to separate from false alarms. A false positive, for example, would be a bullish crossover followed by a sudden decline in a stock. A false negative would be a situation where there is a bearish crossover, yet the stock suddenly accelerated upward.
Since the indicator displays momentum, it can stay overbought or oversold for a long time when an asset has significant momentum in either direction. Therefore, the RSI is most useful in an oscillating market where the asset price is alternating between bullish and bearish movements.
Conclusion: Know what price is doing
The RSI is a great tool and although you could easily guess the RSI value by looking at the past 14 candles, plotting the RSI on your charts can add stability and guidance to your trading. If you can quantify price strength and translate it into interpretable numbers, you can make trading decisions without guesswork and subjective interpretations.
Whether you are using the RSI to identify strength, look for turning points, or as a breakout trader, the RSI is your universal weapon.
- The RSI is an oscillator/momentum indicator
- It can be used to help determine overbought and oversold conditions
- A variance in the highs of the price relative to the highs on the indicator is considered a negative divergence signal
- A variance in the lows of the price relative to the lows of the indicator is considered a positive divergence signal
- The RSI is rangebound in nature and best applied to a rangebound price environment
- In trending environments signals that align with the trend are considered more reliable
- In trending, environments signals against the trend are considered better for exits to trades rather than entries
Free trading tools and resources
Remember, you should have some trading experience and knowledge before you decide to trade with technical indicators. You should consider using the educational resources we offer like NAGA Academy or a demo trading account. NAGA Academy has lots of free trading courses for you to choose from, and they all tackle a different financial concept or process – like the basics of analyses – to help you to become a better trader.
Our demo account is a great place for you to learn more about leveraged trading, and you’ll be able to get an intimate understanding of how CFDs work – as well as what it’s like to trade with leverage – before risking real capital. For this reason, a demo account with us is a great tool for investors who are looking to make a transition to leveraged trading.
Sources:
https://cmtassociation.org/chartadvisor/mastering-the-relative-strength-index-rsi-how-to-read-it-correctly
https://corporatefinanceinstitute.com/resources/career-map/sell-side/capital-markets/relative-strength-index-rsi


