


Bollinger Bands is an advanced form of trading band developed by John Bollinger and used by traders worldwide. But, like any other indicator, they only provide a framework, NOT absolute BUY and SELL signals. All trading bands exist for a single purpose, to answer the question "Are prices relatively high or low?". That bit of information is incredibly valuable and even more powerful if combined with indicators that depict where the price is in relation to the bands and how wide the bands were, along with supply/demand tools.
But here is more...
Of the hundreds of technical indicators out there, the Double Bollinger Bands is Kathy Lien’s favorite: “It provides a wealth of actionable information. They tell us whether a currency pair is in a trend or range, the direction of the trend, and when the trend has exhausted. More importantly, using the standard Bollinger Bands settings with a brilliant modification traders can also identify entry points and proper places to put a stop-loss”.
To get the most out of this guide, practice with a risk-free demo account or copy the moves of top performing traders in real-time with NAGA Autocopy.
Key Takeaways from the Bollinger Bads Technical Indicator
- Bollinger Bands measure volatility and trend strength by using a 20-period Simple Moving Average (SMA) with an upper and lower band set typically two standard deviations away, allowing traders to see if prices are relatively high or low within a flexible price channel that adjusts based on market volatility.
- Double Bollinger Bands (DBB) enhance trading signals by adding a second set of bands at one standard deviation from the SMA, creating zones that indicate whether a trend is strong enough to ride, signaling buy, sell, or neutral (range-bound) market conditions. This method helps identify entry points, stop-loss placements, and trend exhaustion.
- Bollinger Bands can be used with a breakout strategy called the Bollinger ‘Squeeze’, where narrowing bands signal market consolidation and a potential upcoming breakout. A price break above or below the bands, confirmed by widening bands, suggests increasing volatility and the start of a new trend.
- These bands serve as tools, not exact buy/sell signals, and are most effective when combined with other technical or fundamental indicators. They help traders understand price behavior in context, manage risk, and adapt strategies for both trending and range-bound markets, making them versatile and enduring in use across markets.
What are Bollinger Bands
The Bollinger Bands are trading bands that focus on volatility. By allowing the movement of prices themselves to set the width of the bands, John Bollinger's Bollinger Bands can react quickly to market conditions.
Bollinger Bands are a simple yet powerful combination of channels and Moving Averages (MAs). Bollinger Bands consist of a Simple Moving Average (SMA) surrounded by an upper and lower band plotted by a certain number of standard deviations above and below the Simple Moving Average. Think of them as flexible channels whose width varies with price volatility. The wider the price swings over the period of the SMA, the wider the channel; the narrower the price range over this period, the narrower the channel.
Bollinger Band Settings
The default Bollinger Bands settings on most charting software will be a 20-period Simple Moving Average with the bands at two standard deviations from this SMA. The USA500 chart below shows what they look like using these “20, 2” default Bollinger Bands settings.
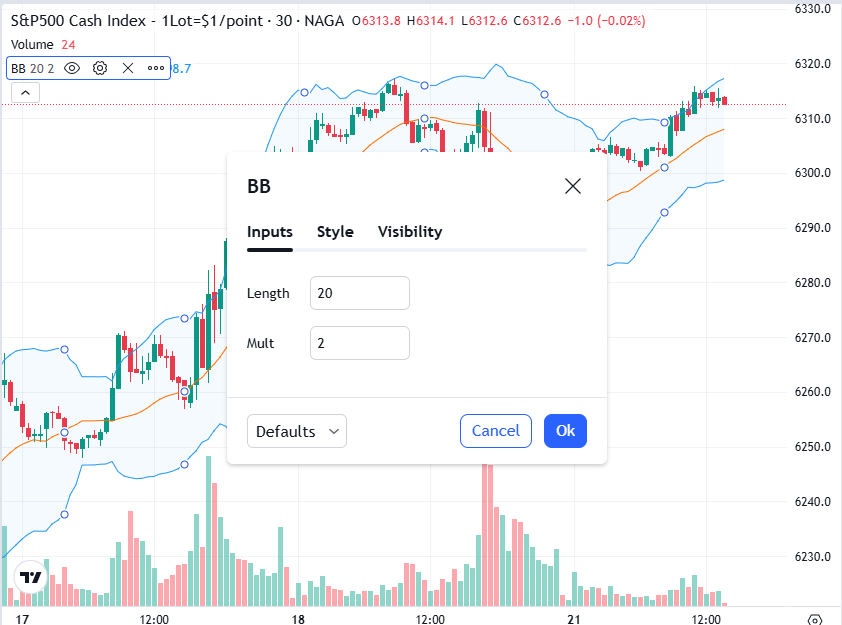
You can change these settings to suit your needs, and later we’ll look at one useful variation, the Double Bollinger Bands. However, the standard settings are popular and are worth watching for the sake of knowing what the herd is seeing as potential support/resistance from the lower and upper bands.
Bollinger Bands Formula
You can perform the Bollinger Bands calculation using the following formula.
- Middle Band = 20-day simple moving average (SMA)
- Upper Band = 20-day SMA + (20-day standard deviation of price x 2)
- Lower Band = 20-day SMA – (20-day standard deviation of price x 2)
The Bollinger Bands indicator is available on our online trading platform, WebApp. Our award-winning platform allows traders to customize technical indicators and tools, add drawing tools to price charts and graphs, and identify chart patterns in order to improve their trading strategy.
How to use Bollinger Bands
The two standard deviation width of the channel means that the statistical probability of price hitting the bands given the price range of the past 20 periods is only about 5 percent. However, like any statistical measure, it assumes that all elements of the sample, in this case, the 20 periods, are the same.
That assumption works for flat, range-bound markets or gently trending markets, which are times when no change occurs in the market's perception of a currency pair’s value. Under those conditions, the upper and lower bands provide reliable support/resistance points. In flat or mild trends, the price tends to fluctuate between the upper and lower bands, as the price bounces off the upper and lower bands like a ball bouncing off the floor and ceiling. Even if price swings widen or narrow, Bollinger bands adjust for those conditions and widen or narrow with the price swings, providing support/resistance points that adjust with volatility (a uniquely valuable feature of Bollinger Bands).
Using the standard default Bollinger Bands settings of a 20-period SMA middle band with each band two standard deviations distance from the middle band, there is only a 5 percent chance that the price will ever touch the outer bands. Again, this calculation assumes (as with any statistical measure) that all sample elements (the past 20 periods) were the same and all prices equally probable. When there’s no strong trend or no trend at all, that assumption applies. Flat price action suggests that market perceptions about the value of security haven’t materially changed.
However, that assumption doesn’t apply in a strong trend, which indicates market perceptions about value are changing.
How to trade with Bollinger Bands
When you see the Bollinger Bands and you want to place a trade, you can do so via derivatives such as CFDs. Derivatives enable you to trade rising as well as declining prices. So, depending on what you think will happen with the asset’s price when one of the Bollinger Bands frameworks appears, you can open a long position or a short position.
Follow these steps to trade when you see the Bollinger Bands framework:
- Trading any type of technical indicator requires patience and the ability to wait for confirmation. The appearance of one of these Bollinger Bands frameworks alerts traders of a price reversal, but until that occurs, most traders leave the pattern alone.
- To get started trading with Bollinger Bands, open an account. Choose between a live account to trade CFDs straight away or practice first on our demo account with virtual funds.
- Choose your financial instrument. Bollinger Bands frameworks can be spotted in most financial markets, especially those that are more volatile, such as forex, cryptocurrencies, and stocks.
- Explore our online trading platform. We offer a wide range of technical indicators that are not limited to Bollinger Bands, as well as providing a range of order execution tools for fast trading, which in turn helps you to manage risk.
The below strategies for trading Bollinger Bands are merely guidance and cannot be relied on for profit.
Double Bollinger Bands
While standard single Bollinger Bands can provide a degree of support or resistance in flat or gently trending markets, Bollinger Bands don’t provide reliable support and resistance in strongly trending markets, because they widen with increasing volatility, so a strong trend can continue to climb the upper or lower band for extended periods.
There’s lots of material written about standard single Bollinger Bands, so we’ll focus on their newer, less covered but far more useful variant, Double Bollinger Bands.
In addition to the standard bands set at two standard deviations’ distance from a 20-period simple moving average (SMA) at the center, add a second set of bands only one standard deviation away from that SMA.
By using Double Bollinger Bands (DBBs), we get a much better indication of:
Whether a trend is strong enough to continue riding or to enter new positions even if it has been going on for a long time. Whether it’s time to take profits or to get ready to trade the reversal.
You don't need to download Double Bollinger Bands. To create them on your candlestick chart, just insert the second set of Bollinger bands at one standard deviation on your moving average. Consult your trading platform’s help menu. For now just know that they are units of distance from the 20-period simple moving average (SMA), which is both the center of the Double Bollinger Bands and the baseline for determining the location of the other Bollinger bands.
Here is an example applied to the USA30 chart.

- A1: The upper Bollinger Bands line that is two standard deviations away from line C, the 20-period simple moving average (SMA).
- B1: The upper Bollinger Band line is one standard deviation from the 20-period SMA.
- C: The 20-period SMA. The figure above is a weekly chart, so this is a 20-week SMA. Again, this is both the center of the Double Bollinger Bands and the baseline for determining the location of the other bands.
- B2: The lower Bollinger Bands line is one standard deviation from the 20-period SMA.
- A2: The lower Bollinger Bands line is two standard deviations from the 20-period SMA.
Notice how these bands form four separate zones. It’s these zones that provide the added information about the strength of a trend, whether it still has the momentum to continue, and where we might attempt to enter trades, even if there is no other support/resistance to serve as a reference point.
Double Bollinger Bands basics

- The DBB Buy zone: When the price is within this upper zone (between the two topmost lines, A1 and B1), that means the uptrend is strong and has a higher probability of continuing. If candles continue to close in this uppermost zone, the odds favor entering or maintaining long positions and closing or avoiding short positions.
- The DBB Sell zone: When the price is in the bottom zone (between the two lowest lines, A2 and B2), the downtrend is likely to continue. That suggests that if the candles close in this lowest zone, one should enter or maintain short positions and close or avoid long positions.
- The DBB Neutral zone: When the price is within the area bounded by the one standard deviation bands (B1 and B2), there is no strong trend. The 20-day simple moving average (C) that serves as the baseline for the Bollinger Bands is in the center of this zone. Typically, one to three candles closing in this area are your signal to exit your trade because the trend is showing weakness.
In other words, Double Bollinger Bands tells us whether we should be trading a trend or a trading range.
- When the pair is in the buy or sell zone (above the top one standard deviation line or below the bottom one standard deviation line), we have a trend that is strong enough to continue trading; it’s probably not too late to get in, though you may want to wait for the trend to retreat to the first standard deviation line, and ideally wait for it to begin to rebound back in the direction of the trend.
- When the pair is within the neutral zone (between the one standard deviation lines), it’s in a trading range. If there’s any trend, it lacks the momentum needed to be tradable. You may be able to trade bounces off the upper and lower channels, but the trend itself lacks enough strength to assume that it will continue without the excessive risk of a reversal that hits our stop loss.
As with most technical indicators, the longer the time frame of the chart on which they’re viewed, the stronger the momentum indicator that Double Bollinger Bands provide.
The four rules for using Double Bollinger Bands in trading
Here’s a short summary of how to use Double Bollinger Bands.
Rule 1: Look to go short when price is within or below the double Bollinger Bands sell zone (bounded by the lower two Bollinger Bands).
- If the price remains within or below the lower two Bollinger Bands, the downward momentum is strong enough so that there is a high probability that the trend will continue lower. This is the time to enter new short positions. Look to exit and take profits when the price moves above this zone.Rule 2: Look to go short when price is within or above the double Bollinger Bands buy zone (bounded by the upper two Bollinger Bands).
- If the price remains within or above the upper two Bollinger Bands, the upward momentum is strong enough so that there is a high probability that the trend will continue higher. This is the time to enter new long positions. Look to exit and take profits when the price moves below this zone.Rule 3: Look to trade the range, not the trend, when price is between the Buy and Sell zones.
- When the price is in the middle zone of the one standard deviation Bollinger Bands, the trend isn’t strong enough to trust, so don’t trade it unless you have enough fundamental evidence or signals from your other technical indicators that suggest the trend will continue. Otherwise, shift your thinking into a range-trading mode and start looking for lows and highs that can serve as potential entry and exit points if the channel is wide enough.Rule 4: Minimize risk by waiting until price retraces to the cheaper end of the Buy or Sell zone or take partial positions.
- This rule attempts to reduce the risk of buying at the top or selling at the bottom that comes when chasing a strong trend. This rule is not easy to implement. Your success depends on how well you read the other technical and fundamental evidence, and how well you can understand whether you’re catching a bargain or a falling knife.
Thus, the key qualification to Rule 4: There should be no major contradictions from other technical indicators or fundamental data that suggest the trend is in fact exhausted. If there are, stand aside, and don’t trade until the situation clarifies.
Bollinger Bands Breakouts – Bollinger Squeeze
When the upper and lower Bollinger Bands are moving towards each other, or the distance between the upper and lower bands is narrow (on a relative basis), it is a suggestion that the market under review is consolidating.
A consolidation phase suggests that the market is non-directional for the time being and now rangebound in nature. The narrow or narrowing Bollinger Bands will essentially move closer to the price and at some stage appear to be ‘Squeezing’ the price. It is at this stage that breakout traders might pay attention.

The highs and lows of consolidation may be marked by trend lines. A price moves above the high of the consolidation would consider an upside breakout, while a price close below the low of the consolidation would consider a downside breakout. The Bollinger Bands can now be used as a filter for these breakout trade scenarios.
An upside breakout might be confirmed with a price close above the resistance trend line as well as above the upper Bollinger Band. A downside breakout might be confirmed with a price close below the support trend line as well as below the lower Bollinger Band.

It is also preferable to see the upper and lower band starting to widen in a breakout scenario. The widening of the bands suggests an increase in volatility to confirm the move out of consolidation and into a new trend.

The narrow bands suggest a period of low volatility often associated with a sideways market environment (consolidation). Widening bands suggest an increase in volatility often associated with a trending market environment. Volatility is considered cyclical in nature in that a period of low volatility is a precursor to high volatility and vice versa. Combining price breakouts with Bollinger Bands is often referred to as a volatility breakout strategy. The strategy whereby we wait for a narrowing of Bollinger Bands as a precursor to a breakout is known as a Bollinger ‘Squeeze’.
Bollinger Bands Summary
At the end of the day, Bollinger Bands are tools. They can be used in the creation of your own trading strategies and approaches. John Bollinger’s indicators are used by traders around the world and across many different markets in a wide array of approaches. Because they are tools, not a system, and because Bollinger Bands applications are so diverse, they continue to work year after year as they are adapted and applied in new ways.
The Bollinger Bands indicator is a lagging indicator that does not produce trading signals. It can help you stay on the right side of the trend and spot potential reversals, though. For that, you'll need to:
- Add a set of bands as presented above.
- Use it in combination with leading indicators.
Some of these complementary technical analysis tools can be found on the NAGA.com platform, including RSI, MACD, Stochastic, ADX, Ichimoku, and many others.
Free trading tools and resources
Remember, you should have some trading experience and knowledge before you decide to trade with indicators. You should consider using the educational resources we offer like NAGA Academy or a demo trading account. NAGA Academy has lots of free trading courses for you to choose from, and they all tackle a different financial concept or process – like the basics of analyses – to help you to become a better trader.
Our demo account is a great place for you to learn more about leveraged trading, and you’ll be able to get an intimate understanding of how CFDs work – as well as what it’s like to trade with leverage – before risking real capital. For this reason, a demo account with us is a great tool for investors who are looking to make a transition to leveraged trading.
Sources:


